Posts

Showing posts from January, 2024

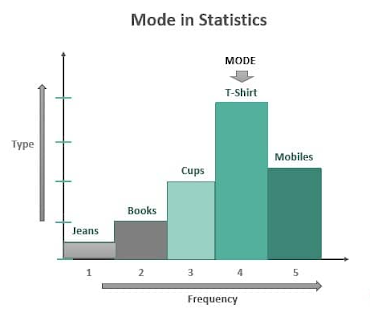
Mode example (Grouped data)

Image
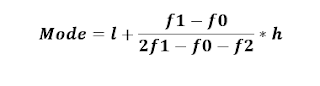
  Below given is the data representing the scores of the students in a particular exam. Let us try to find the mode for this: Exam Score (x i )   (f i ) 41-50 2 51-60 9 61-70 7 71-80 15 81-90 6 90-100 3   Modal class = 71 - 80 (This is the class with the highest frequency). The Lower limit of the modal class (l) = 71, Frequency of the modal class (f1) = 15, Frequency of the preceding modal class (f0) = 7, Frequency of the next modal class (f2) = 6, and Size of the class interval (h) = 10. Thus, the mode can be found by substituting the above values in the mode formula, Therefore, the mode for the above dataset is 75.71.

Formula for Mode

Image
  Ungrouped Data: For ungrouped data, mode is the value or values that appear with the highest frequency. Grouped Data: Here,   l = Lower limit of the modal class   h = Size of the class interval (assuming all class sizes to be equal)   f1 = Frequency of the modal class   f0 = Frequency of the class preceding the modal class   f2 = Frequency of the class succeeding the modal class
Image
T he mode is a measure of central tendency that represents the most frequently occurring value in a dataset. In other words, it is the value or values that appear with the highest frequency. Unlike the mean and median, which represent central values in the dataset, the mode identifies the value(s) that occur most frequently. A dataset can have: Ø No Mode : If all values occur with the same frequency, or if there are no repeated values, the dataset is said to have no mode. Ø Unimodal : If one value occurs more frequently than any other, the dataset is unimodal, and that value is the mode. Ø Bimodal : If two values have the highest frequency and occur more frequently than other values, the dataset is bimodal. Ø Multimodal : If more than two values share the highest frequency, the dataset is multimodal. For example , in the dataset [2, 4, 4, 6, 7, 4, 8], the mode is 4 because it appears more frequently than any other value.

Merits and Demerits of Median

Image
 

Properties of Median

Image
 

Median example (Grouped data):

Image
  Let’s consider the following frequency distribution that shows the exam scored receive by 40 students in a certain class: Exam Score (x i )   (f i ) CF 51-60 9 9 61-70 7 16 71-80 15 31 81-90 6 37 90-100 3 40 Here, n= 40. Therefore, n/2 = 40/2 = 20 Thus, the observations lie between the class interval 61-70, which is called the median class. Therefore, Lower class limit = 61 Class size, h = 10 Frequency of the median class, f = 7 Cumulative frequency of the class preceding the median class, CF = 16. Now, substituting the values in the median formula given above, we get Median= 61 + (20-16)/7 *10 =  66.71 Therefore, the median marks for the given data are 66.71.

Median example (Ungrouped data)

Image
  Find the median of the following data for marks in Statistics (out of 100). {99, 34, 45, 72, 98, 40, 62, 21} Step 1: Order the values from low to high 21, 34, 40, 45, 62, 72, 98, 99 Here, n (total number of observations) is 8, which is even, so we will use the formula given below: Thus, median marks in Statistics are 53.5.

Median example (Ungrouped data):

Image
  Find the median of the following data for weekly pay in US (in dollars): {350, 800, 220, 500, 130} Step 1: Order the values from low to high 130, 220, 350, 500, 800 Here, n (total number of observations) is 5, which is odd, so we will use the formula given below: Step 2: Calculate the middle position Step 3: Find the value in the position obtained in step 2 From step 1 value present at 3 rd position is 350. Thus, median weekly pay is 350 US dollars.

Median

Image
The median is a measure of central tendency that represents the middle value of a dataset when it is ordered from least to greatest. In other words, it is the middle value that separates the higher half from the lower half of a dataset. Median Formula :  The median formula is different for even and odd numbers of observations. Therefore, it is necessary to recognize first if we have odd number of values or even number of values in a given data set. The formula to calculate the median of the data set is given as follows:

Relationship Between Arithmetic Mean, Geometric Mean and Harmonic Mean

Image
  If a and b are two positive numbers, then. Arithmetic Mean= AM= Geometric Mean = GM=  Harmonic Mean=   = GM 2 /AM   Example : What will be the Harmonic mean if Geometric mean is 13 and Arithmetic Mean is 18 for any given data. HM= GM 2 /AM HM= 13 2 /18 HM= 169/18 HM= 9.39

Merits and Demerits of Harmonic Mean

Image
 

Properties of Harmonic Mean

Image
 

Harmonic Mean example (Weighted data)

Image
  Let’s consider the following grouped data to calculate the Harmonic mean: Weight ( f i )   (x i ) f i / x i 2 10 0.20 5 5 1.00 6 15 0.40 4 25 0.16 1 30 0.03 8 20 0.40 Hence, the harmonic mean for the given data is 11.87.

Harmonic Mean example (Ungrouped data)

Image
Find the Harmonic mean of the following data: {4, 5, 10, 8, 12, 6, 11} Step 1: Finding the reciprocal of the values 1/4= 0.25 1/5= 0.2 And so on… Step 2: Calculate the average of the reciprocal values obtained from step 1. Here, n is 7. Average = (0.25 + 0.2 + 0.1 + 0.125 + 0.083 + 0.167 + 0.90)/7 Average = 1.825/7 Step 3: Finally, take the reciprocal of the average value obtained from step 2.   Harmonic Mean = 1/ Average   Harmonic Mean = 7/1.825   Harmonic Mean = 3.836   Hence, the harmonic mean for the given data is 3.836.

Harmonic Mean

Image
The harmonic mean is a type of average that is calculated by dividing the number of observations by the reciprocal of each number in the dataset. It is the reciprocal of the arithmetic mean of the reciprocals of the numbers. Formula:

Merits and Demerits of Geometric Mean

Image
 

Properties of Geometric Mean

Image
 

Geometric Mean example (Grouped data)

Image
  Let’s consider the following grouped data to calculate the Geometric mean:

Geometric Mean example (Ungrouped data)

Image
  Find the geometric mean of the following data: {4, 10, 16, 24, 45, 6} Here, n is 6. Therefore, geometric mean is: G= (4* 10* 16* 24* 45* 6) 1/6 G= (53913600) 1/6 G= 12.68 Therefore, the G.M of the given data is 12.68.

Geometric Mean

Image
  Geometric mean is the measure of central tendency which is calculated by using the product of the set of numbers. Technically it is " the nth root product of n numbers ", where n is the number of values. ·         Formula:

Merits and Demerits of Arithmetic Mean

Image
 

Properties of Arithmetic Mean

Image
 

Arithmetic Mean example (Grouped data)

Image
  Let’s consider the following grouped data: First, step is to calculate mid-point ( m i ) for each interval: So, the mean for this grouped data is approximately 41.14.

Arithmetic Mean example (Ungrouped data)

Image
  Let's go through an example to illustrate the calculation of the arithmetic mean:   Suppose we have the following dataset of exam scores for a class of students:   {85, 90, 95, 78, 69, 55}   To find the arithmetic mean, we add up all the scores and then divide by the total number of scores: Therefore, the arithmetic mean of the exam scores is 79 (approx.). This means that, on average, the students scored 79 points on the exam.

Arithmetic Mean

Image
Arithmetic Mean: It is one of the measures of central tendency which represents the average of a numerical set of data. It is calculated by adding up the numbers and dividing it by the total number of observations in the data. It is simply called as ‘Mean’. ·         Formula: