Posts

Showing posts from December, 2023

Measures of Central Tendency

Image
  Measure of central tendency are the statistics which describes the center or average of the data with the help of single value from the data. This value represents the center of the data distribution. Measures of central tendency are sometimes called measures of central location.  Each measure of central tendency has its strengths and weaknesses, and the choice of which to use depends on the nature of the data and the specific characteristics of the distribution.

Descriptives Measures

Image
  Lesson 2: What are descriptive measures? ·         Definition: Descriptive measures are the statistics which helps us to summaries the data often known as summary statistics . It helps us to get the meaningful insights such as summary, variability or distribution of the data. Now we will discuss all measures of descriptives statistics one by one with the advantages and limitations of each one of them including examples which helps you to understand how we can calculate these measures using the different types of data. Types of descriptive statistics: There are 3 main types of descriptive statistics:   The central tendency concerns the averages of the values. The variability or dispersion concerns how spread out the values are. The distribution concerns the frequency of each value.

Summarizing Statistics

Image
 

Key Concept of Statistics - Presentation of data

Image
As soon as data collection is done, we need to find a way to present the data in most meaningful, efficient way such as tables, text, graphs, charts, tren ds etc.  Presentation of data is the easiest way of  presenting the  results of findings from collected data using appropriate data analysis techniques or tools. Data presentation is powerful tool which makes data understandable & readable at the same time while attracting & keeping the interest of its readers and effectively showcase large amounts of complex data in a simplified manner. Data can be presented in a variety of formats, including: Tables: Tables are a simple and effective way to present data. They are particularly useful for presenting precise numer ical data. Graphs and Charts: Graphs and charts are often used when it’s helpful to visualize trends, comparisons, or relationships in the data. This includes bar graphs, line graphs, pie charts, scatter plots, and more. Maps: For data with a geographical comp

Key Concept of Statistics - Interpretation of data

Image
  ·          Interpretation of data: Data interpretation is the process of reviewing data and drawing meaningful conclusions using a variety of analytical approaches. It involves translating raw data and statistical outputs into meaningful insights, conclusions, and implications that can be used to inform decision-making, answer research questions, or gain a deeper understanding of a phenomenon .

Key Concept of Statistics - Data Analysis

Image
  ·          Data Analysis: Data analysis is the process of applying statistical or logical techniques to evaluate or illustrating data to get the useful information. It includes various statistical and mathematical techniques to draw the meaningful insights from the data which eventually helps us in decision making or solving our business, finance or quality related problems. This is a very crucial step in turning raw data into actionable knowledge. There are a number of analyses that can deal with on different type of data. Some of them are: Once the data collection is done, next step would be cleaning and organizing the data for analysis. Once the cleaned data is ready you can apply any data analysis method based on your purpose. Your analysis may also include data visualization, data mining, trend etc.

Key Concept of Statistics - Uses of data collection

Image
  ·          Uses of data collection: Data that we collect can be useful in many ways and in many fields. Effective data collection can help us to solve numerous problems, helps in decision making, getting accurate results, understanding the process and so on. Data collection serves various important purposes across different fields and disciplines. Some of the fields where data collection plays a vital role are: Data also helps you to be more strategic, increase efficacy, determining the cause of the problem and also in improving the quality of life. The insights gained from well-executed data collection efforts contribute to informed decision-making and improved outcomes.

Key Concept of Statistics - Types of data

Image
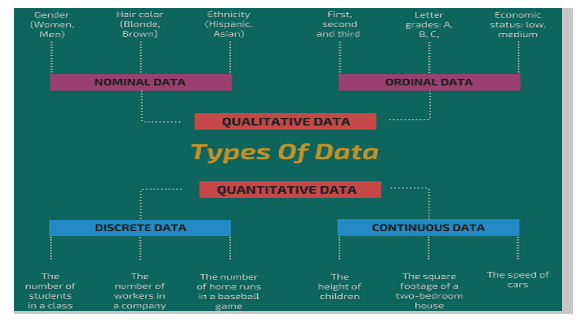
  ·          Types of data: Data can be broadly classified into two main types: qualitative data and quantitative data. These types of data have distinct characteristics and are analysed using different methods and tools. Qualitative Data: Qualitative data is information that cannot be counted, measured or easily expressed using numbers. It is collected from text, audio and images to describe the qualities or characteristics of a source. For example: colors, names, cities etc. It is majorly used in content analysis, or narrative analysis. Quantitative Data: Quantitative data consists of numeric information that can be measured and counted. For example: age, height, speed etc. It is used majorly in statistical analysis. There are other types of data which includes Categorical data, binary data, time series data and spatial data. Understanding the type of data is crucial for choosing appropriate analysis methods and drawing meaningful conclusions from research or observations.

Key Concept of Statistics - Methods of data collection

Image
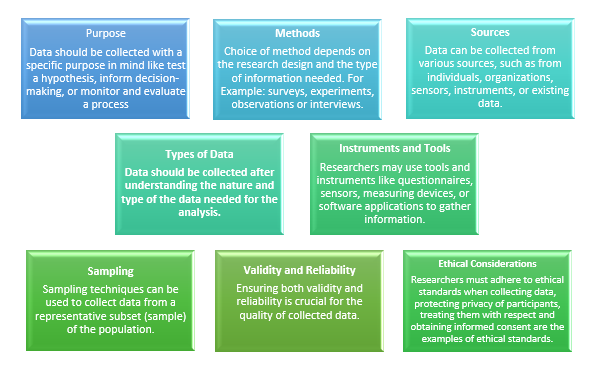
  ·          Methods of data collection: The purpose of data collection is to get useful insights and findings. Data to be collected by keeping the research goals, target audience and nature of data in mind. There are a lot of data collection methods based on the type of data you want to deal with. Data can be collected on various topics and from multiple resources. Here are some most common and useful methods of data collection. Surveys and Questionnaires: It is the easiest and most efficient way of collecting data. Surveys involve collecting data from a sample of individuals or groups through structured or semi-structured questionnaires. It can be done in person, through phone, email etc. Interviews: In-depth interviews involve direct interaction between the researcher and the participant. This method allows for detailed exploration of responses and is often used in qualitative research. It may include face to face or telephonic interviews where personal interaction is e

Key Concept of Statistics - Collection of data

Image
  ·          Collection of data: Refers to the process of gathering information or observations on a specific topic or phenomenon for the purpose of analysis, interpretation, and decision-making. Data collection is a critical step in statistical analysis, and various methods can be employed depending on the research objectives, the nature of the data, and the resources available. Here are some key points to kept in mind at the time of data collection : The process of data collection is foundational to any scientific or research endeavor. The quality of the collected data significantly influences the validity and reliability of subsequent analyses and conclusions. Proper planning, careful design, and attention to ethical considerations are essential elements of effective data collection.

Introduction to Statistics

Image
  Lesson 1: What is Statistics? ·         Introduction to the field of statistics: Statistics is a branch of mathematics that deals with the collection , analysis , interpretation , presentation , and organization of data. It provides a framework for making inferences and drawing conclusions from data, helping to understand patterns, relationships, and trends in various phenomena. It plays a crucial role in various fields, including science, business, economics, social sciences, medicine, and more. The field of statistics is fundamental to scientific research, decision-making in business and industry, government policy formulation, and numerous other areas where data-driven insights are crucial.   History : The history of statistics dates back to ancient times, with the earliest forms of data collection and analysis emerging in various civilizations. The earliest known use of statistical methods can be traced back to ancient civilizations such as Babylon, Egypt, and China.